
Project Baselines & Forecasts
Project Baselines
Project Baselines make it possible to save project schedules at different points in time in order to compare the current state of a project to its past state. This information can provide key insights as to where a project fell off schedule or out of scope and can be viewed while a project is in flight or during a post-project review. Further expanding on that data, Forecasts use comparisons between the baselines and current project schedule to predict how the rest of the project is likely to play out. This information can help teams rectify issues with project scope and time or expense overruns in order to keep projects from running too far off course. Baselines and Forecasts can be found in the Baseline tab of the project tray in the Projects module.

NOTE: Project Baselines & Forecasts is an Enterprise level feature of Workzone. For more details on upgrading your team's Workzone license to Enterprise, please contact us at help@workzone.com or call 610-275-9861.
Learn more about Workzone Enterprise.
IN THIS ARTICLE
Creating a Baseline
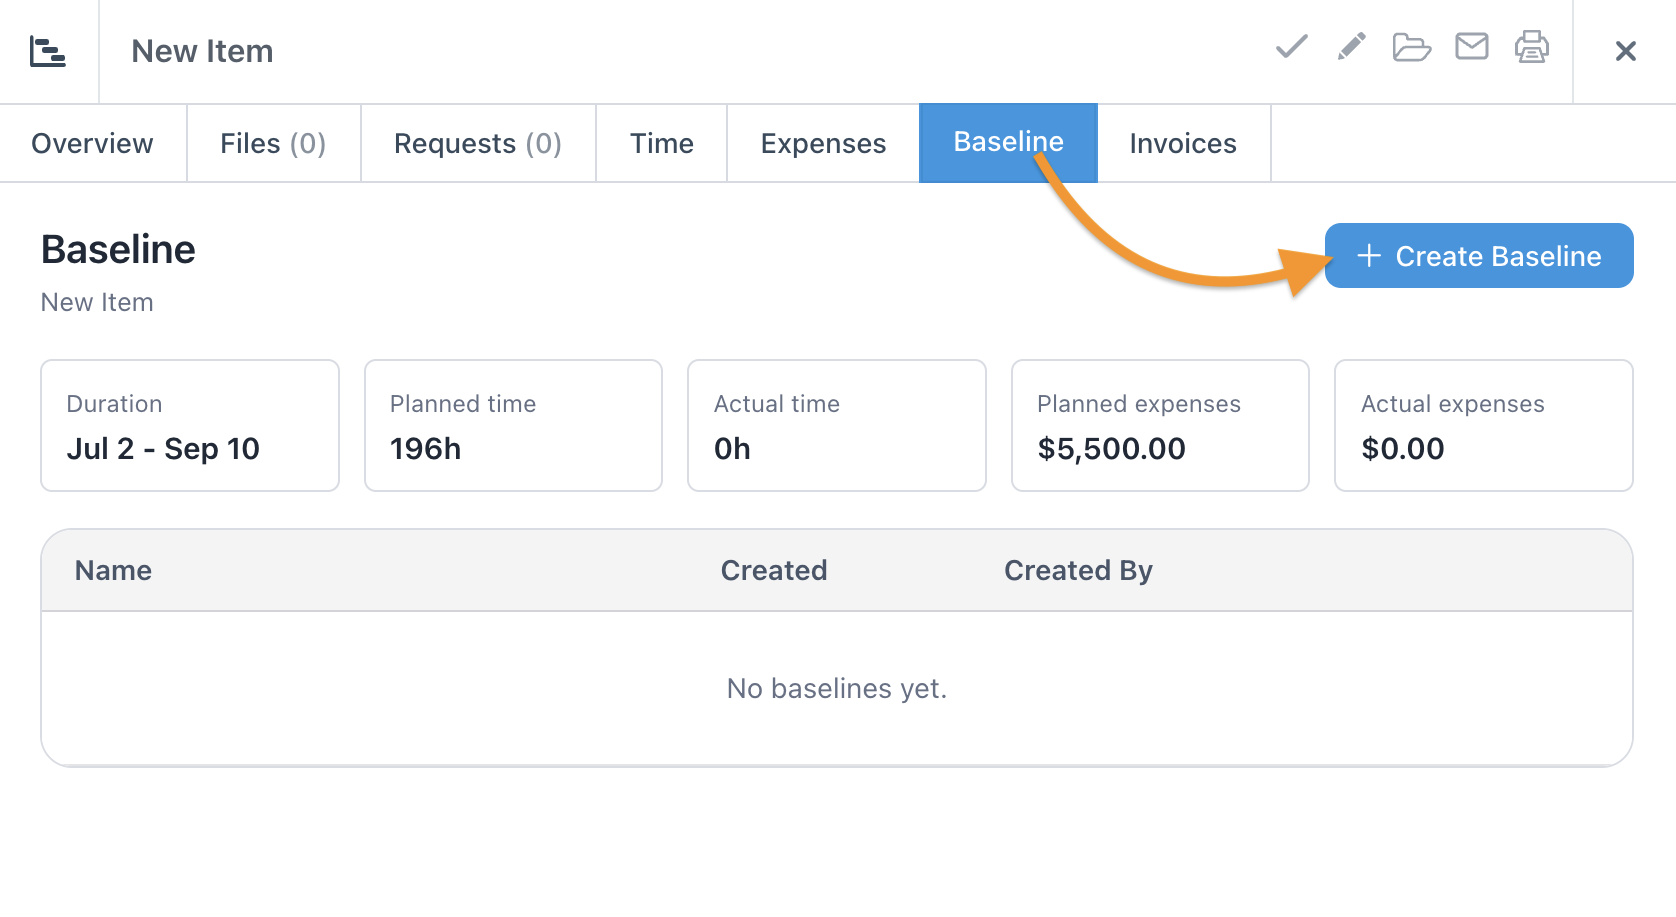
Any Administrator or Manager-level user can create a new baseline at any time by visiting the Baseline tab of the project tray and clicking the Create Baseline button at the top of the tray.
Additionally, Workzone will automatically create a baseline when a task in a project is first marked as complete or first has a time or expense entry applied.
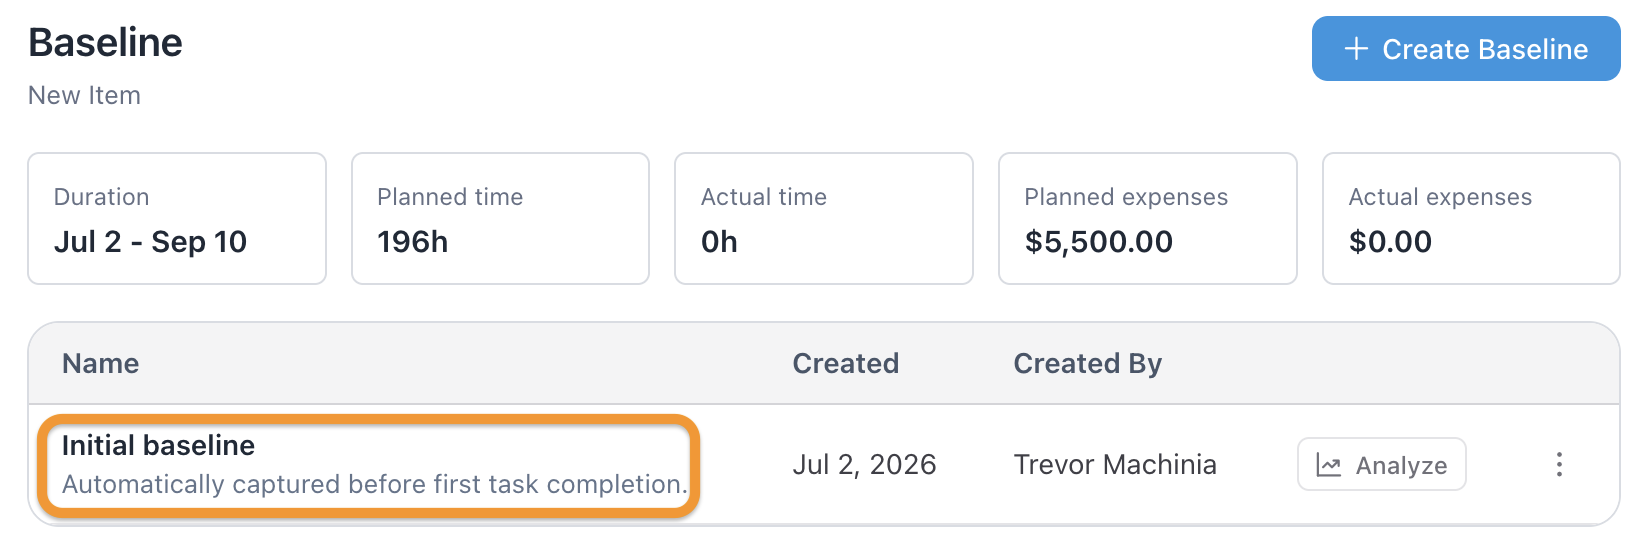
Baselines will store the following data for analysis:
- Project and task duration
- Project and task workload
- Project and task planned time (workload)
- Project planned expenses (expense budget)
- Task actual time
- Task actual expenses
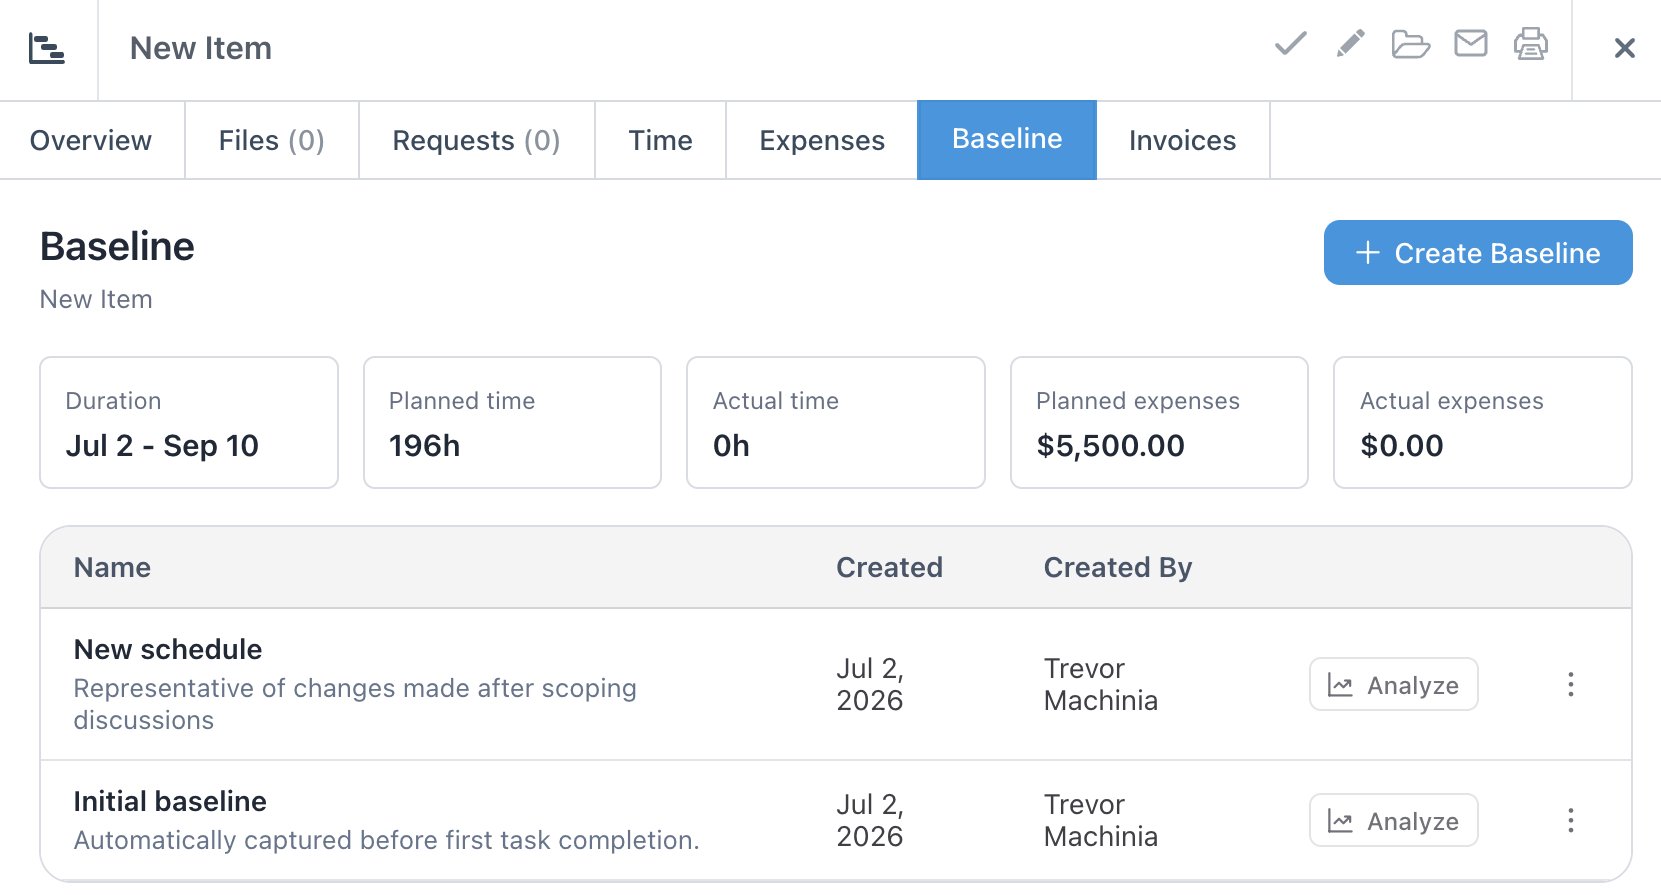
Multiple baselines can be created, and each can be viewed/analyzed at any point. Each baseline will show the date on which it was created and the user who created it:
Analyzing a Baseline
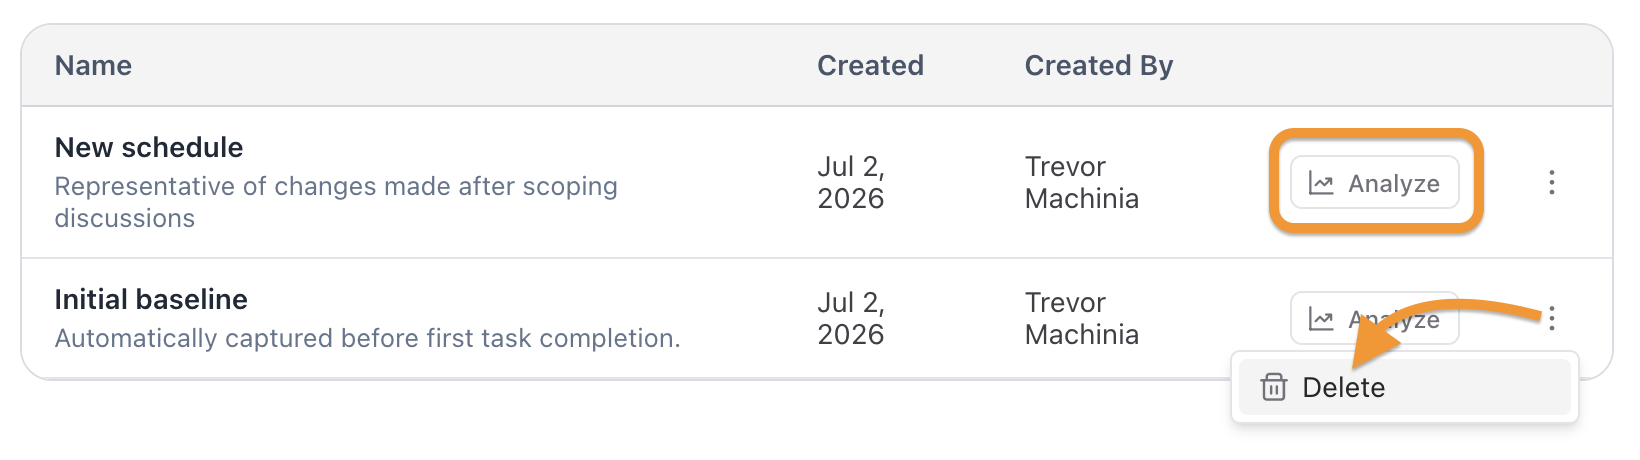
All user types are able to see and analyze baselines. All saved baselines are listed in the main Baseline area of the project tray, and any baseline can be analyzed by clicking the Analyze button. Admins and Managers have the ability to delete baselines by using the option in the more menu.
When analyzing a baseline, several pieces of data and analysis are displayed. All analysis will compare the data in the saved baseline to the current state of the project today. First, at the top, a project baseline overview is displayed:
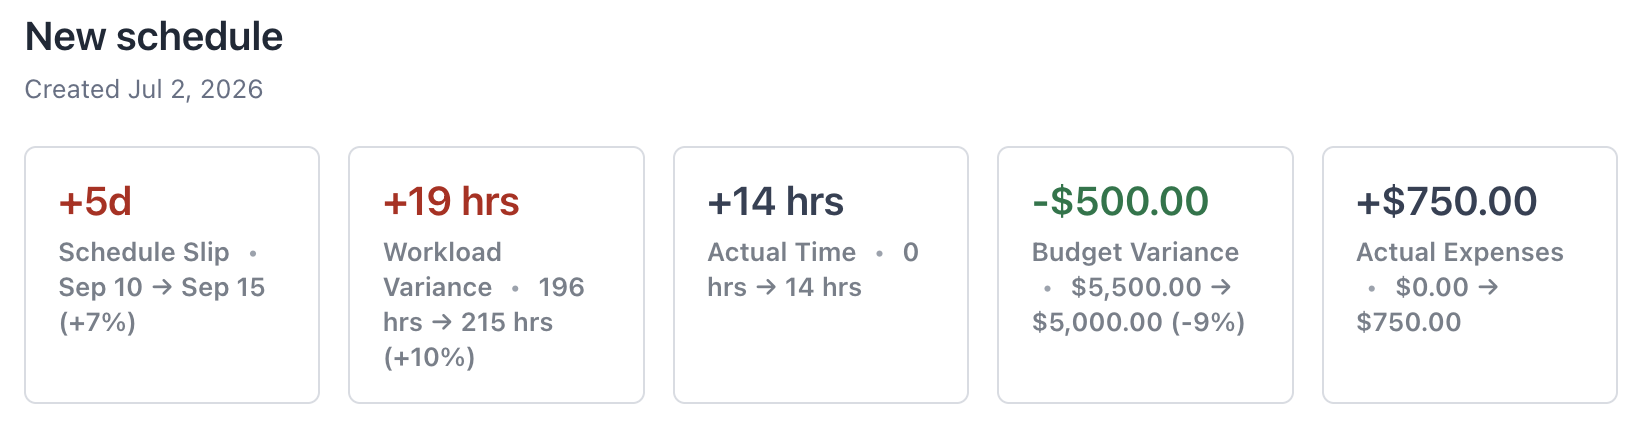
- Schedule slip will show by how many days the project schedule has increased or decreased. An increase will show in red text whereas a decrease will show in green text.
- Workload variance will show by how many hours the project workload value has increased or decreased. An increase will show in red text whereas a decrease will show in green text.
- Actual time will show the amount of hours logged by users on tasks within the project.
- Budget variance will show by how many dollars the project expense budget has increased or decreased. An increase will show in red text whereas a decrease will show in green text.
- Actual expenses will show the amount of monetary expenses logged by users on tasks within the project.
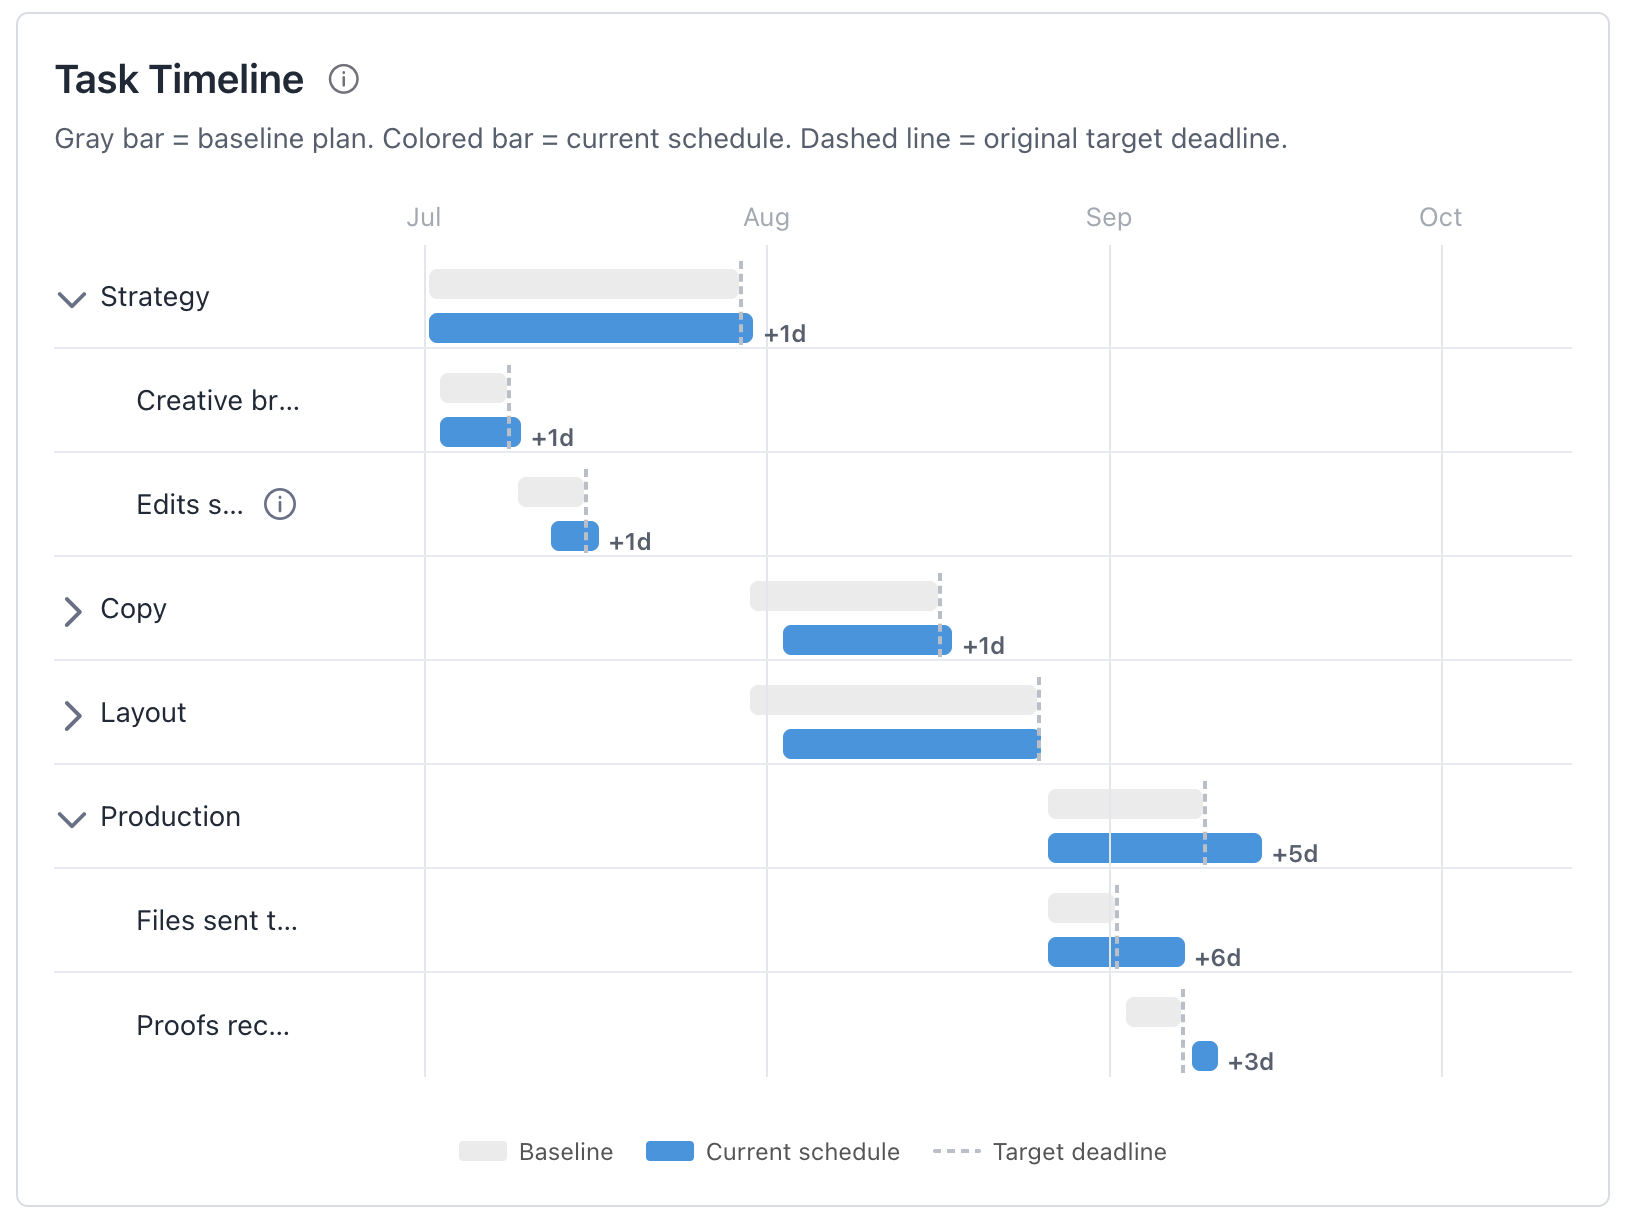
Below the overview is the Task Timeline. This will display any task whose dates and/or duration have been modified since this baseline was created. Gray bars show the original dates/duration whereas blue bars show the current dates/duration. Dashed lines will show the previously scheduled end date of the task as compared to the new end date. This section will scroll vertically to show additional tasks:
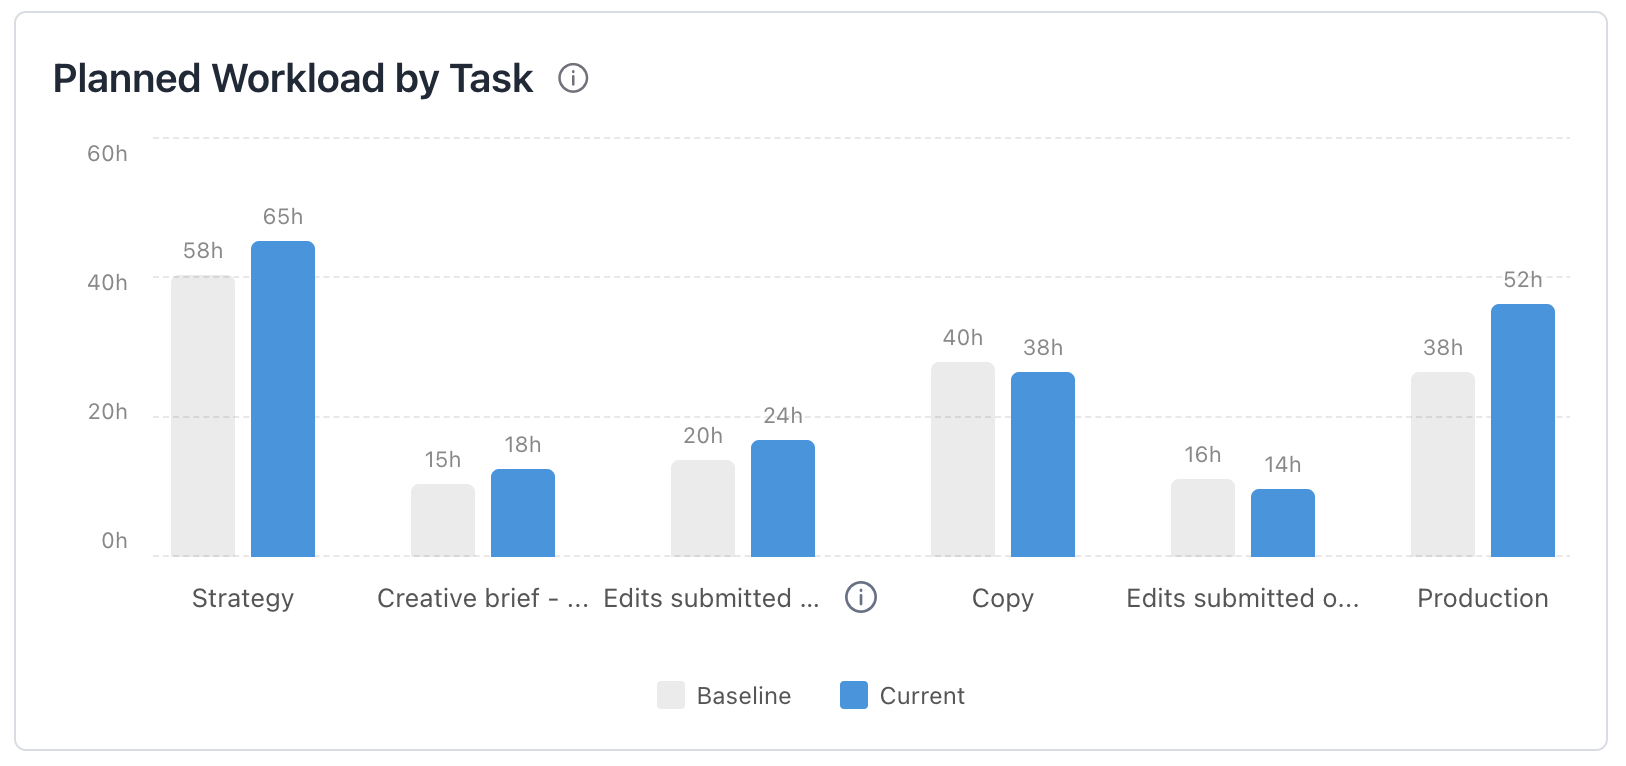
Below the Timeline is the Planned Workload by Task. This specifically compares the scheduled workload values in the baseline (gray bars) to the current workload values (blue bar). This section will scroll horizontally to display additional tasks.
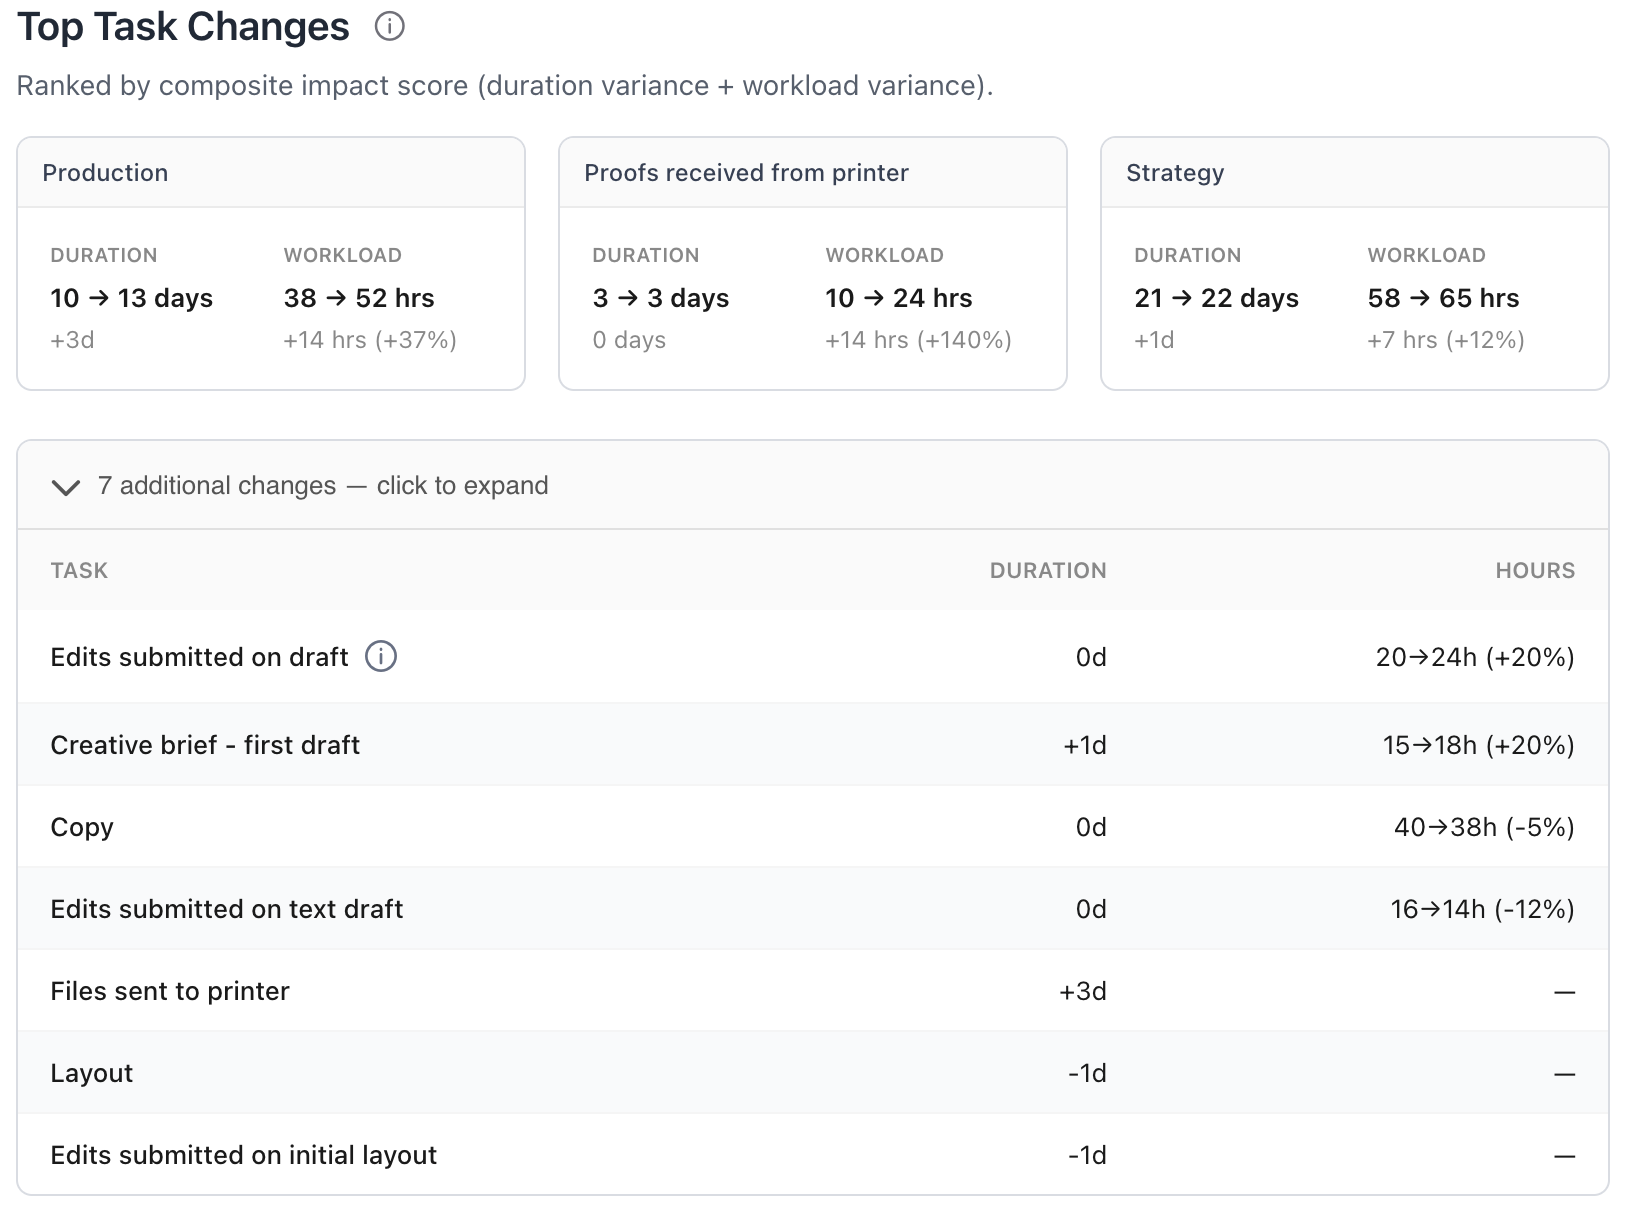
Below the Planned Workload is the Top Task Changes. At the top of this section will be 3 tiles that display tasks with the most drastic duration and/or workload variances. Beneath that will be an expandable list that displays all task duration and workload changes throughout the project.
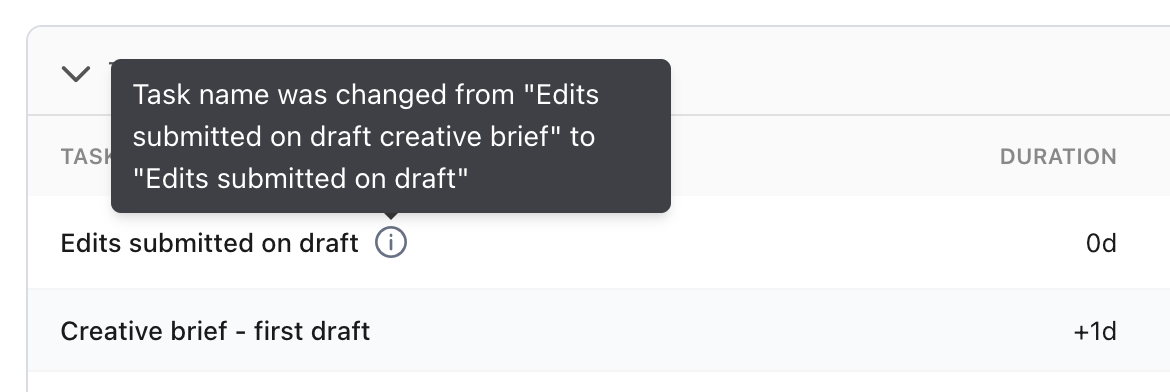
In each of these views, for any task that was renamed, a small ⓘ icon will appear next to he task name. Hovering over the icon will display the old task name and new task name.
Forecasts
Each baseline on a project will have an associated forecast. All available forecasts can be found on the baselines listed in the main Baseline area of the project tray. A forecast only becomes available once at least one tasks has been marked as complete in the project. Once a forecast is active, it can be viewed by clicking the Forecast button on the baseline row:

When viewing a forecast, several pieces of data and analysis are displayed. All analysis will compare the data in the saved baseline to the current state of the project today and use that information to extrapolate what the future of the project may look like. Only tasks that are marked as complete in the project will be evaluated for the forecast, and only incomplete tasks will have the forecast applied to them in the analysis.
First, the "information" icon to the right of the Deviation analysis heading will display details around the number of tasks that were used to generate the forecast and the number of tasks to which the forecast is applied:

Next, key details about the project schedule, time tracking, and expense tracking are displayed in tiles:

Hovering your mouse over any of the values in the tiles will display informational popups to describe how those values were calculated:

- Duration Variance calculates the average changes to the duration of the tasks in the set of completed tasks. That average duration, represented as a percentage, is then applied to the rest of the incomplete tasks in the project to forecast the increase or decrease in the expected duration for those tasks.
- Average Schedule Slip calculates the difference in the start dates of each of the completed tasks. That average slip is then applied to the rest of the incomplete tasks in the project to forecast how many days the start date of those tasks may move.
- Forecast Schedule Slip displays the expected shift to the overall end of the project based on the calculations from the previous two tiles.
- Remaining Time calculates the amount of actual time applied to the completed tasks in the project and compares that value to the amount of budgeted time on those tasks (the workload value) to create a % of actual time tracked vs. budgeted. This percentage is then applied to the incomplete tasks to forecast the amount of time to be tracked through the remainder of the project. The value displayed on the tile represents the increase or decrease in actual time expected to be tracked vs. the budget.
- Forecast Time is a reflection of the % of actual time tracked vs. budgeted value calculated in the Remaining Time tile.
- Remaining Budget calculates the amount of actual expenses applied to the completed tasks in the project and compares that value to the project's expense budget (the project's % complete value is used to calculate how much of the expense budget should have been used by this point in the project) to create a % of actual expenses vs. budgeted. This percentage is then applied to the incomplete tasks to forecast the amount of expenses to be tracked through the remainder of the project. The value displayed on the tile represents the increase or decrease in actual expenses expected to be tracked vs. the budget.
- Forecast Budget is a reflection of the % of actual expenses tracked vs. budgeted value calculated in the Remaining Budget tile.
Below the overview is the Forecasted Task Timeline. This will display tasks if the task durations or schedules are forecasted to change. Gray bars show the original dates/duration whereas blue bars show the current dates/duration and orange bars show the forecasted dates/durations. Dashed lines will show the previously scheduled end date of the task as compared to the new end date. This section will scroll vertically to show additional tasks:

Below the Timeline is the Forecasted Workload by Task. This specifically compares the scheduled workload values in the baseline (gray bars) to the current workload values (blue bar) and forecasted workload values (orange bar). This section will scroll horizontally to display additional tasks.

Below the Forecasted Workload is the Top Forecasted Task Changes. At the top of this section will be 3 tiles that display tasks with the most drastic forecasted duration and/or workload variances. Beneath that will be an expandable list that displays all of the forecasted task duration and workload changes throughout the project.
